Counting looks simple until you try to do it quickly, accurately, and without losing track. That’s where tally marks come in. They may look primitive, just a series of lines scratched onto paper, wood, or a chalkboard, but they’re one of the most enduring tools in human history.
From ancient bones carved with notches to modern factory check sheets and classroom charts, tally marks have been quietly keeping order for tens of thousands of years.
Let’s walk through what tally marks are, how to write them correctly, why we group them in fives, where they came from, and how they’re still used across science, business, and everyday life.
Key Highlights
- Tally marks are simple one-stroke counts grouped in bundles of five for quick reading.
- The five-bar gate pattern improves accuracy and speed by matching how humans perceive small numbers.
- They remain vital in classrooms, research, quality control, and manual vote counts.
- Clear rules, consistent bundling, and neat strokes keep tallies reliable and transparent.
What Exactly Are Tally Marks?
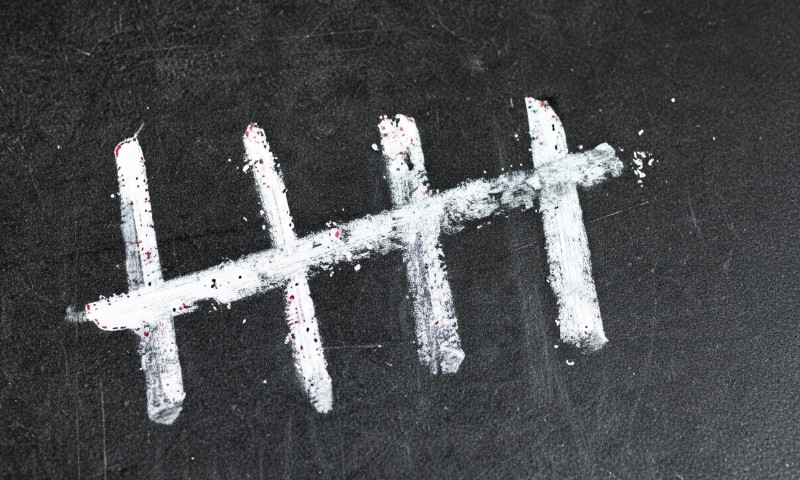
Tally marks are simple, repeated strokes that record counts or occurrences. Each stroke represents one unit: one object, event, or observation. After four vertical lines, the fifth stroke crosses through them to form a group of five. It looks like this:
||||| = 5
That pattern of four straight marks plus a crossing line is called the five-bar gate, and it’s the standard in English-speaking countries and much of Europe.
Why We Group by Five
Our brains are wired to recognize small quantities instantly, a process called subitizing. Without counting, we can tell the difference between one, two, three, or four objects at a glance. But once we get past four, our perception slows down. We need to count manually.
Grouping tally marks in bundles of five takes advantage of that limit. You can look at a page full of five-bar bundles and know instantly how many sets of five there are, then quickly add any leftover strokes. It’s fast, accurate, and efficient.
Cognitive research supports this pattern. Psychologists have found that while people can make quick, nearly effortless judgments for small quantities, they slow down considerably beyond that range. By grouping tallies into fives, we’re essentially matching how our brains prefer to see numbers.
In some experiments, people have even been found to compare groups faster with tally-like visuals than with digits in short-term counting tasks. That’s one reason the method has lasted so long: it fits human perception perfectly.
How to Write Tally Marks

- Draw one vertical line for each item you’re counting.
| = 1
- Keep adding lines for each new item until you reach four.
|||| = 4
- On the fifth item, draw a diagonal or horizontal line across the previous four.
||||\ = 5
- Start a new bundle after every fifth mark.
||||\ ||||\ = 10
This structure helps you total up numbers quickly by counting in fives instead of ones. It’s much easier to spot four complete bundles and know instantly that you have twenty than to scan through twenty single strokes.
Variations in Style
- Some people draw the crossing line horizontally, others diagonally.
- In East Asian scripts or right-to-left writing systems, the direction of the bundle may flip, but the logic stays identical.
- Digital systems sometimes use unique symbols for tally marks (more on that shortly).
Unicode and Digital Tally Symbols
Even in the digital age, tally marks have found a place in computer systems. The Unicode Standard includes tally-like symbols within its Counting Rod Numerals block, as well as Ideographic Tally Marks.
These provide a way to display tally systems consistently across different software, ensuring that ancient counting methods can still appear cleanly in digital documents.
It may sound niche, but for researchers, linguists, and typesetters, having standardized symbols for tally marks is crucial. It keeps text searchable, machine-readable, and consistent across platforms.
A Short History of Tally Marks
View this post on Instagram
Long before calculators or written numbers, early humans carved notches into bones and stones to track quantities. One of the oldest known artifacts is the Ishango bone, discovered near the headwaters of the Nile in Central Africa.
Dated to around 20,000 years ago, it contains groups of notches that many scholars interpret as an early counting aid, possibly related to arithmetic or calendar tracking.
The idea is simple: mark once per event or object, then group the marks to keep totals organized. That same principle survives today every time a teacher tallies attendance or a fieldworker tracks bird sightings.
Medieval Tally Sticks
During medieval times, tally marks evolved into tally sticks, especially in England. These were notched wooden sticks used to record debts and payments. The English Exchequer relied on them for centuries.
Clerks would carve notches representing monetary amounts, then split the stick lengthwise. One half, called the stock, was kept by the debtor, and the other, the foil, by the creditor. Only the matching pair would fit together, preventing fraud.
Tally sticks remained a trusted accounting tool until the 19th century. Ironically, when the British government decided to dispose of the old sticks by burning them in 1834, the fire spread and destroyed much of the Palace of Westminster. A historic end for a humble tool.
Modern Uses of Tally Marks
Teachers love tally marks because they bridge concrete and abstract thinking. Children can easily see that each stroke equals one item. Later, when they total the marks, they start grasping the concept of frequency – how often something occurs.
Tally charts often accompany lessons in early mathematics, statistics, and data visualization. For example, students might record how many classmates prefer each fruit, then total the tallies to create a bar graph.
In Fieldwork and Research
In ecology, psychology, and classroom observation, researchers use tally marks to record the frequency of behaviors or events. For instance:
- A teacher might tally how many times a student raises their hand.
- A wildlife researcher might record every bird call heard in a 10-minute window.
- A nurse might track each patient arrival in an emergency department hour by hour.
In Manufacturing and Quality Control
In factories and service operations, tally marks appear on check sheets, a foundational quality control tool. Workers tally how often specific defects, delays, or events occur during a shift. Later, supervisors total the counts and use them to create Pareto charts or run charts.
The reason tally marks work so well here is that they minimize distraction. Workers can keep their focus on the process instead of pausing to write full numbers.
In Elections and Civic Counting
Even in an age of electronic voting and machine tabulation, manual tallying remains part of official vote verification in many regions.
Precinct workers may tally paper ballots on sheets, marking one line per vote and crossing every fifth mark. This approach keeps the count visible and verifiable by multiple observers at once.
The key to accuracy lies in clear rules and double-checking. Two people may tally independently and reconcile differences at the end of each batch. The process might look low-tech, but it’s transparent and traceable.
Building a Proper Tally Chart
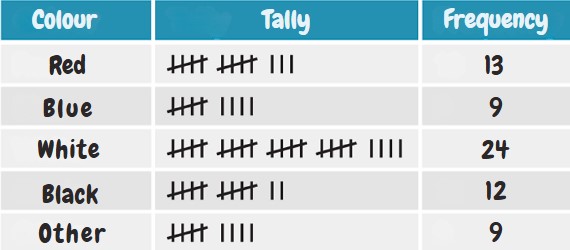
A clean tally chart typically includes three columns:
- Category: What you’re counting (fruit, defect type, behavior, etc.)
- Tally: The live count, updated as events happen
- Frequency: The numeric total, written after tallying is complete
Tips to Prevent Counting Errors
Even a simple method benefits from structure. Small mistakes can ripple through a dataset. Here are ways to keep your tallies clean and reliable:
- Set clear counting rules: Decide exactly what qualifies as “one.” If you’re counting customer visits, define whether multiple transactions by the same person count separately.
- Always group in fives: Bundling in fives speeds up totaling and makes errors easier to spot.
- Add a frequency column: Write the total next to your tallies as soon as you finish a batch. It prevents misreads and double counting.
- Use consistent time blocks: If you’re tracking rates (like cars passing per hour), divide your sheet into equal time intervals.
- Cross-check with others: For high-stakes data, votes, quality audits, or clinical observations, have two recorders tally independently and compare results.
- Keep the original sheet: Never throw away the raw tallies. They serve as a transparent record for future review or audits.
Common Mistakes to Avoid
@mathcelebrity
- Letting tallies run endlessly without bundling. Break them into fives to stay readable.
- Changing what counts as “one” mid-process. Keep the definition consistent.
- Copying partial totals too early. Always finish tallying before you total or graph.
- Making messy or uneven marks. Clean, short strokes make all the difference.
- Erasing errors. Instead, circle them and start fresh on the next line. That keeps your record honest.
Digital Tally Tools
While pen and paper work perfectly, digital tools can make tallying easier to store and analyze. Many apps and spreadsheet templates let you click or tap to add tallies automatically. They can also convert tallies into charts instantly.
When publishing digital tallies, you can use Unicode symbols for consistency. Still, for most purposes, the hand-drawn five-bar gate remains the clearest and fastest method.
Why Tally Marks Still Matter
Tally marks are the simplest way to capture real-time data without calculation or distraction.
They also carry a visual honesty. Anyone can look at a page of tallies and verify the count. No formulas, no filters, just transparent data.
That blend of simplicity and clarity explains why tally marks still show up everywhere: schools, field notebooks, clinics, warehouses, and voting precincts. They bridge human perception and data collection in a way no other tool quite does.
FAQs
Final Takeaway
Tally marks might be one of humanity’s oldest counting tools, but they haven’t lost their place in modern life. They work because they fit the way our brains see small numbers, they keep data transparent, and they’re fast enough for real-time tracking
Whether carved into bone twenty millennia ago or marked on a classroom worksheet today, the principle hasn’t changed: one mark, one count, one reliable record.
If you ever need to count something by hand, skip the calculator for a moment. Grab a pen, group your tallies in fives, and you’ll have one of the simplest, most effective counting systems ever invented, right there on the page.